WorkSite is a cloud-based Data & Analytics product developed by DB&A to provide clients with the ability to gauge performance and productivity at all levels of operations. It provides management insight into real-time data thus allowing them to make business decisions based on the numbers.
WorkSite houses the suite of management operating tools that are designed to take administrative burden away from our clients and redirect their focus to what matters the most – the people. It enables managers and supervisors to stay engaged with their employees and focus on developing right behaviors to ensure success in their operations. WorkSite has the capability to integrate with existing data systems used by the client, but can also be used as a stand-alone tool with a user-friendly interface.
Features & Capabilities:
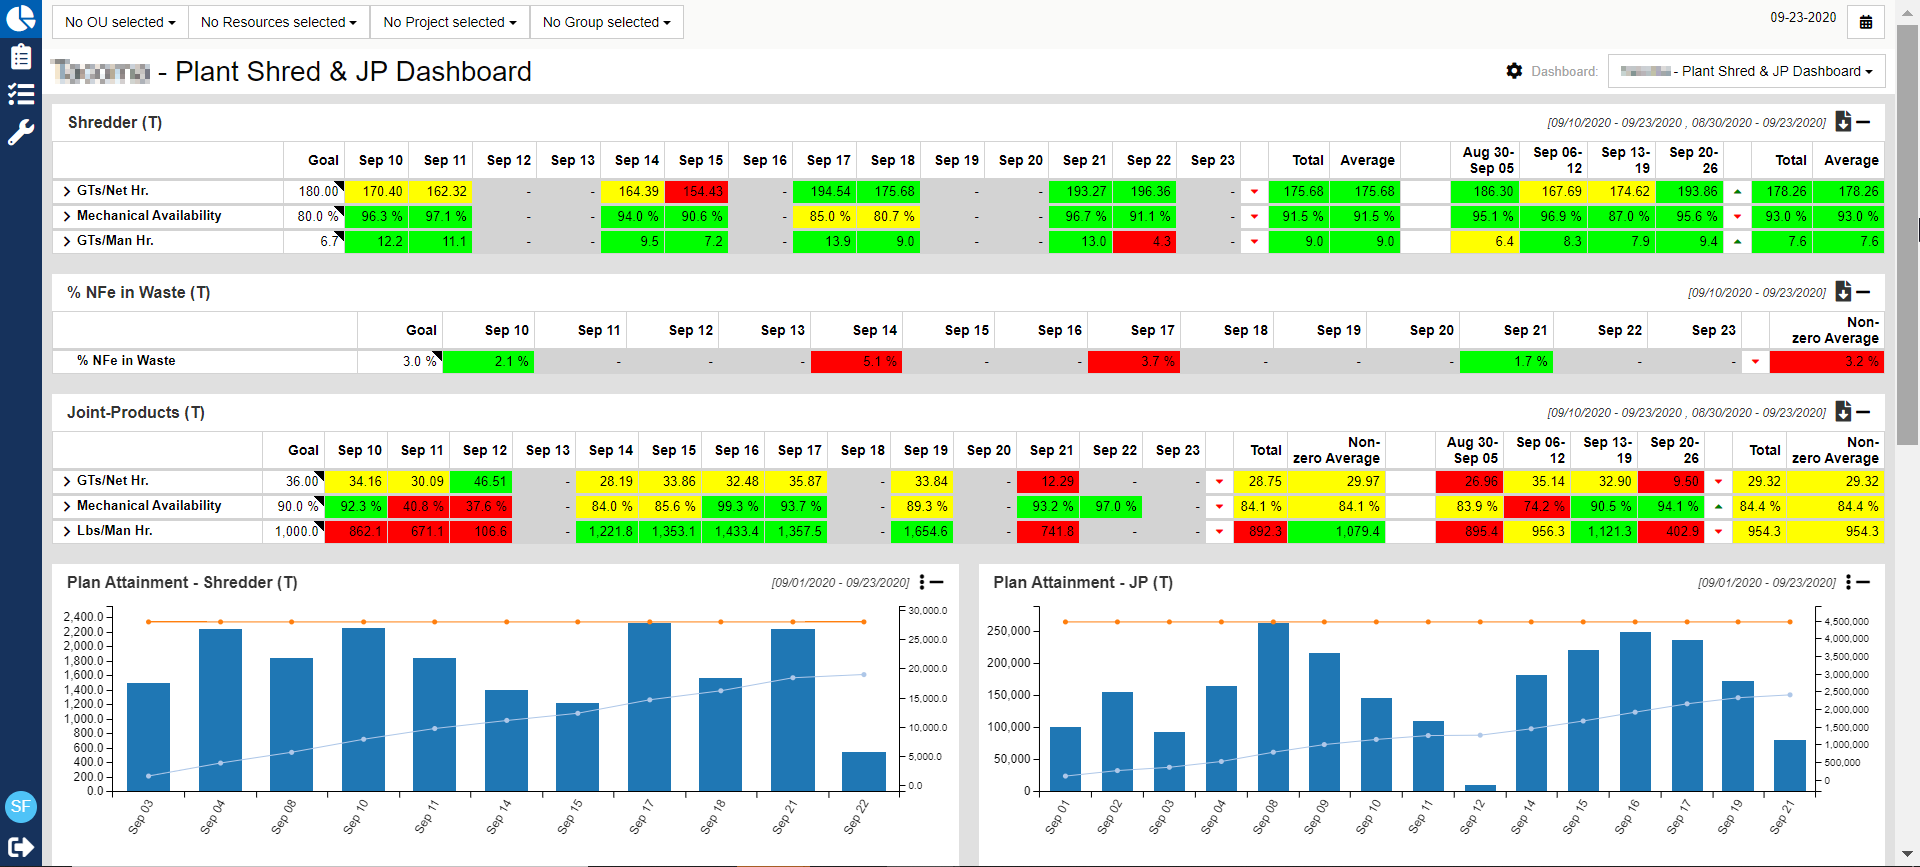
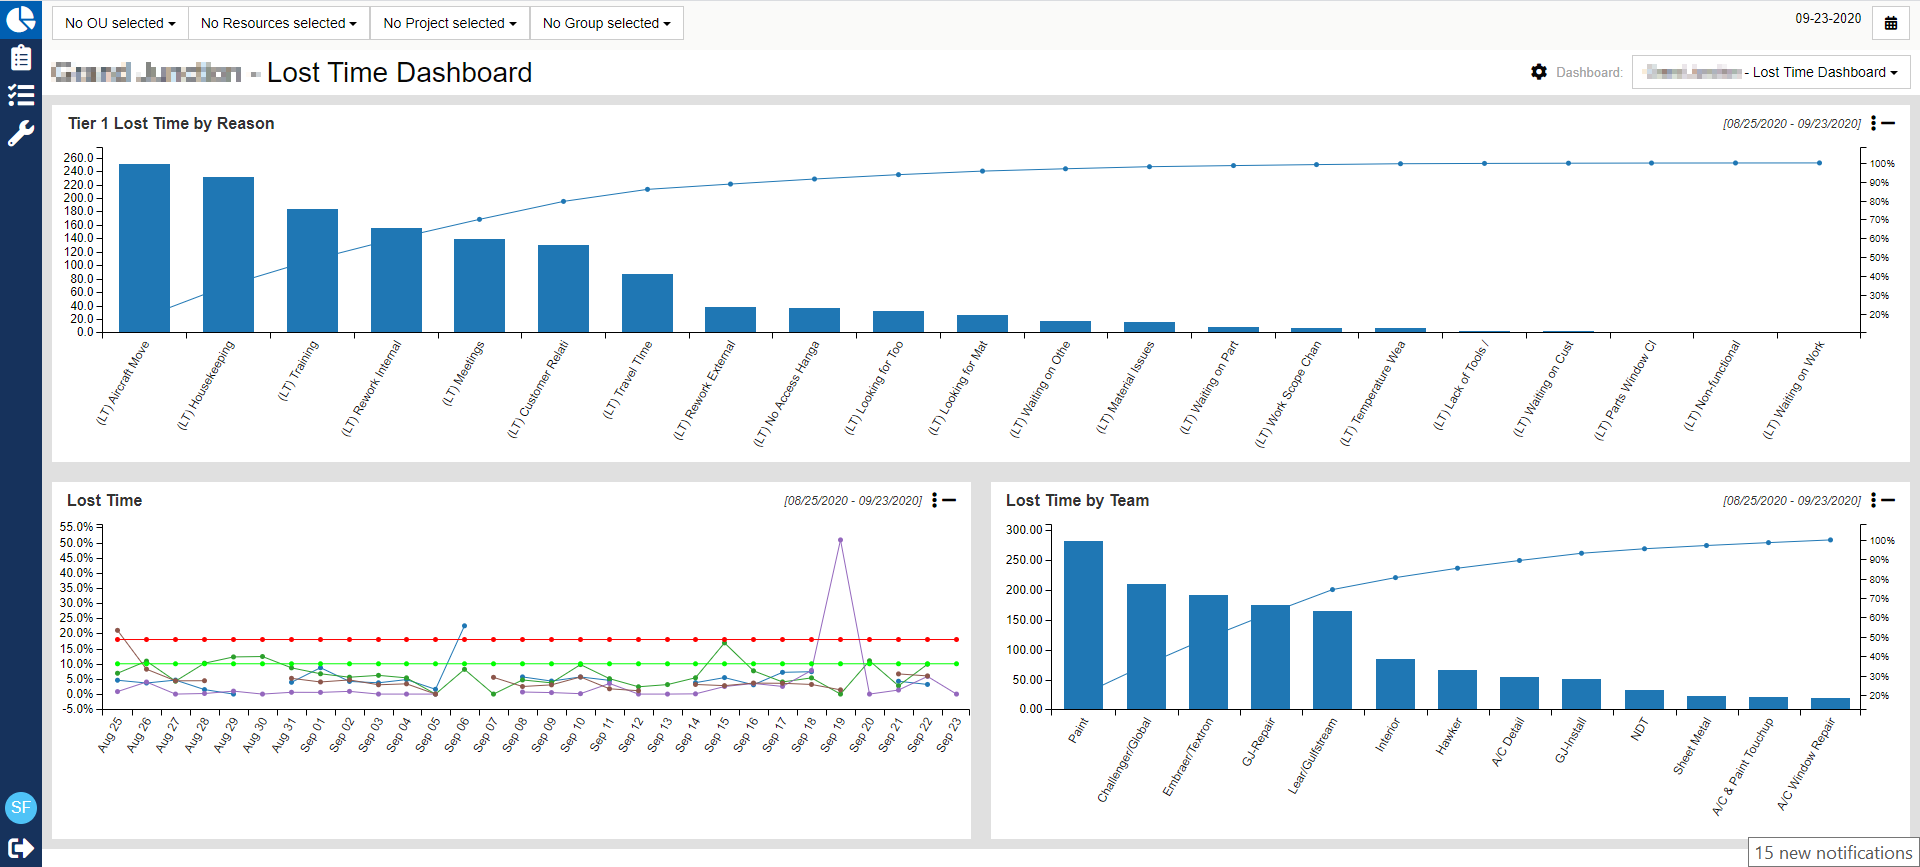
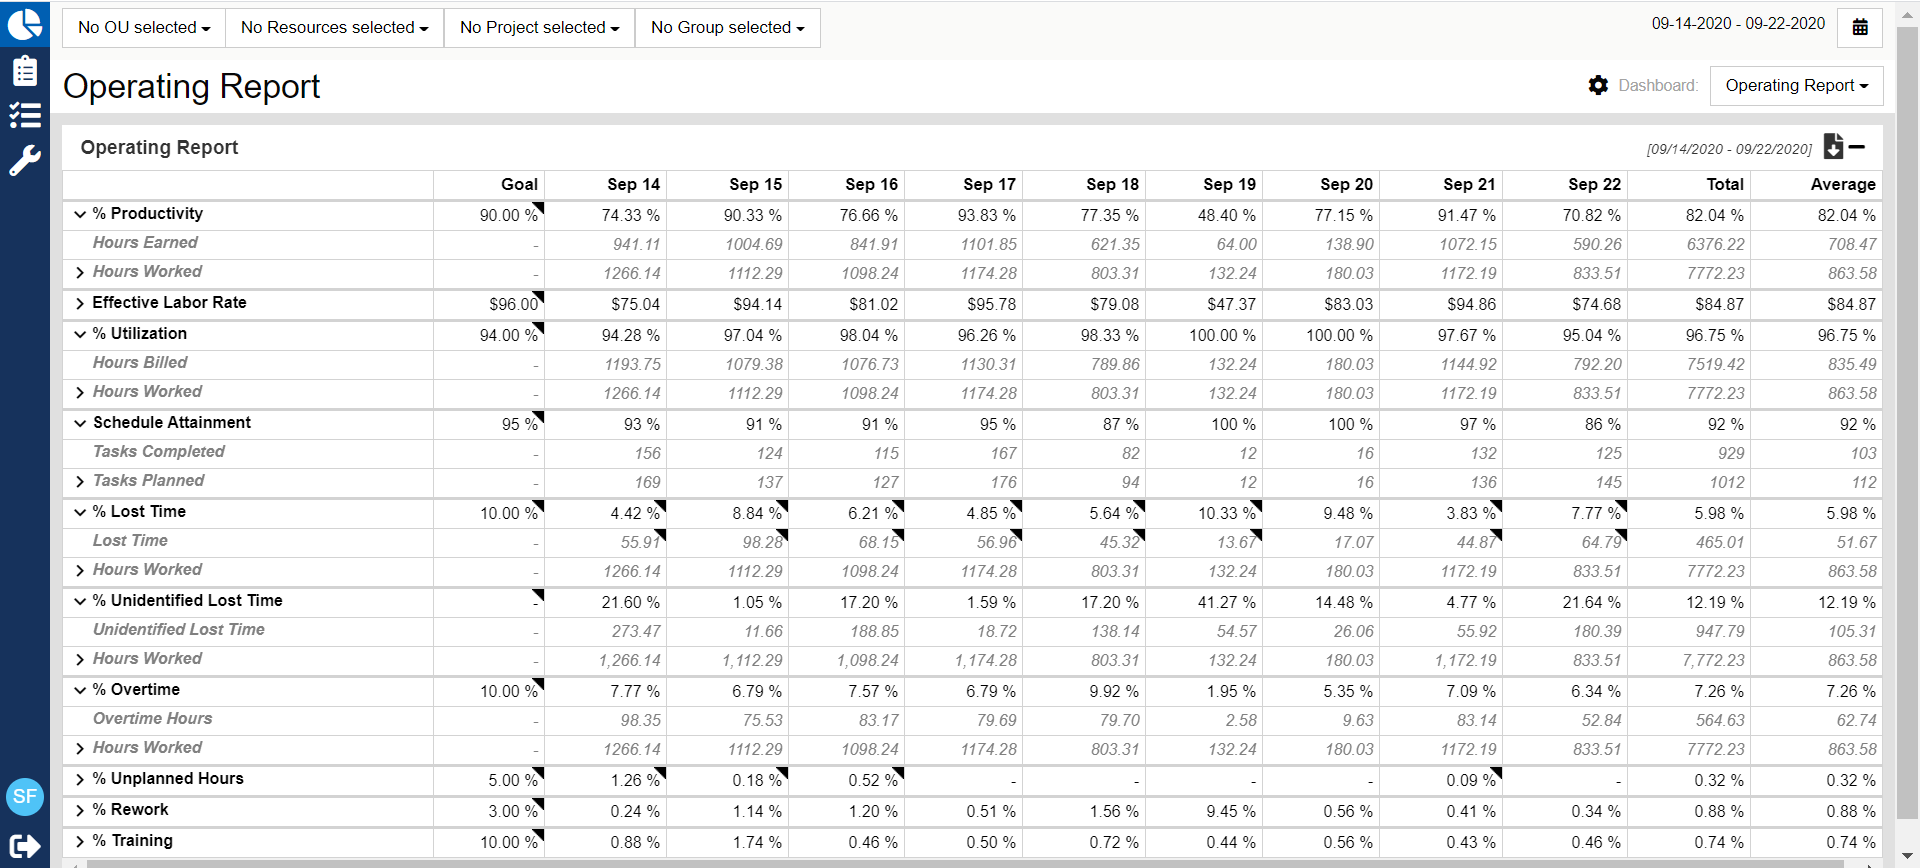
- Visual Dashboard displays various reporting widgets such as operating reports, trend charts, and capacity charts.
- Operating log captures data directly in the software which reports out the results into the dashboards.
- Action items capture next steps and track the completion of key deliverables.
- Integrated data feeds to reduce admin time.
How WorkSite meets the business needs of our Clients:
- Enables management to make informed decisions, leading to better outcomes and achieve operational excellence, by providing insights into the operations.
- Ensures continuous improvement by providing end-to-end view and measurements of key operational metrics.
- Identifies opportunities to streamline operations and maximize profits.
- Provides transparency into planned vs current state of the operations.
- Optimizes scheduling and managing of people and performance ranging from a department to individual level.
- Provides short- and long-term data trends to better manage the business.
- Proactively anticipates operational needs so course corrections can be made as needed.


